

Table of Contents
ToggleCauses that will have an effects on XAUUSD (GOLD)
Gold price advances to a two-week top amid the emergence of fresh USD selling. Rising Fed rate cut bets keep the US bond yields depressed and weigh on the buck. Traders look to the US jobless claims for some impetus ahead of the NFP on Friday.
- XAU/USD trades at the upper end of its weekly range, just above the $2,350 mark, following the release of mixed United States (US) figures. On the one hand, the country reported that the private sector added 152K new positions, according to the May ADP survey.
The figure missed expectations, a tepid sign of a cooling labor market. Additionally, the ISM Services PMI improved more than expected in May, jumping to 53.8 from 49.4 in April.
- The market reaction to the latest news indicates that investors are uncertain about what the Federal Reserve (Fed) may decide on monetary policy in the upcoming June meeting.
Weekly Gold Forecast Direction : Sideways Up
- Gold to profit as bonds are no longer a safe haven
- China’s green push to boost green metals demand
- Rising inflation expectations and the Fed’s pause create an ideal storm for Gold
- Gold has kept up with inflation and has increased over that
Monetary policy has become restrictive enough and is unravelling the growth story - Gold miners’ pain may be bullion investors’ gain
- Silver supply inadequate amid monstrous industrial and investment demand
XAU/USD Technical Overview
From a technical point of view, XAU/USD has a limited bullish potential, according to the daily chart. The pair keeps meeting sellers around a flat 20 Simple Moving Average (SMA), acting as dynamic resistance at around $2,360.80. The longer moving averages keep heading north far below the current level, denying the long-term bearish case. Finally, technical indicators turned higher but develop within neutral levels, not enough to confirm a bullish extension.
According to the 4-hour chart, XAU/USD retains a neutral stance in the near term. Technical indicators offer neutral-to-bearish slopes within positive levels, suggesting buyers are not interested at the current levels. At the same time, the pair is trapped within directionless moving averages, with the 100 SMA at $2,364.10 reinforcing the resistance area.
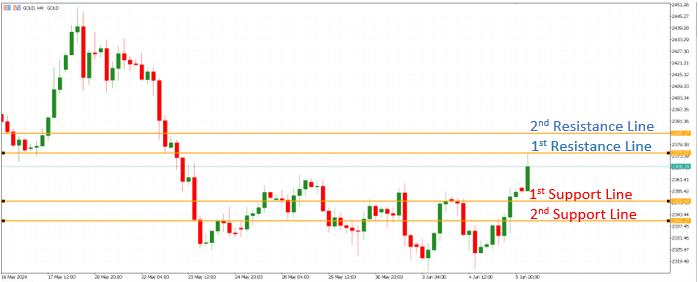
Technical View
1st Support Line 2350 1st Resistance Line 2390
2nd Support Line 2375 2nd Resistance Line 2385
Note: The above information may be inaccurate. Investors should not use this as a basis for deciding to place a trade.
·