Table of Contents
ToggleCauses that will have an effects on XAUUSD (GOLD)
- Gold price (XAU/USD) gains momentum on Friday despite the modest rebound in US Dollar (USD). The yellow metal edges higher as many economists expect a weakening labor market could prompt the Federal Reserve (Fed) to cut interest rates sooner than currently expected to stimulate economic growth. Furthermore, the renewed geopolitical concerns are likely to be a positive factor for gold’s value on the market.
- However, the hawkish US Fed talks on the interest rate, and the stronger US dollar (USD) might weigh on gold prices. Gold traders will keep an eye on the first reading of the US Michigan Consumer Sentiment Index for May, along with the speeches from the Fed’s Bowman, Goolsbee, and Barr. Next week, the US Consumer Price Index (CPI) report will be in the spotlight.
Weekly Gold Forecast Direction : Sideways Down
Gold to profit as bonds are no longer a safe haven
Rising inflation expectations and the Fed’s pause create an ideal storm for Gold
Gold has kept up with inflation and has increased over that
Monetary policy has become restrictive enough and is unravelling the growth story
Gold miners’ pain may be bullion investors’ gain
- However, the hawkish US Fed talks on the interest rate, and the stronger US dollar (USD) might weigh on gold prices. Gold traders will keep an eye on the first reading of the US Michigan Consumer Sentiment Index for May, along with the speeches from the Fed’s Bowman, Goolsbee, and Barr. Next week, the US Consumer Price Index (CPI) report will be in the spotlight.
·
XAU/USD Technical Overview

If gold bulls step in at the $2,400 psychological mark, then yellow metal could see a rally to an all-time high near $2,432, en route to the $2,500 figure. On the flip side, the first downside target will emerge at the resistance-turned-support level at $2,340. Extended losses for gold price expose XAU/USD to a potential support level at the $2,300 round mark, followed by a low of May 2 at $2,281.
Technical View
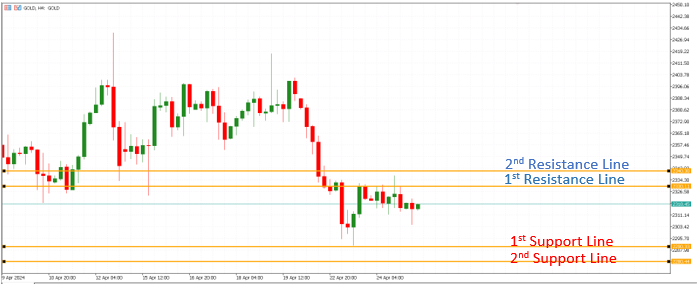
1st Support Line 2330 1st Resistance Line 2365
2nd Support Line 2320 2nd Resistance Line 2375
Note: The above information may be inaccurate. Investors should not use this as a basis for deciding to place a trade.


